The Collections view pane displays a summary of the analysis, arranged by type. It is best explained by example.
In this example we've placed two different Collection view panes side by
side. On the left we see the results of an analysis of a deployment of Scheme
changes. On the right we the results of an analysis of a deployment of Object
changes. Both are fairly dramatic examples where a full customer database is being
deployed, done for illustrative purposes. Typically Collection views will be
simpler and contain fewer items and bad references. 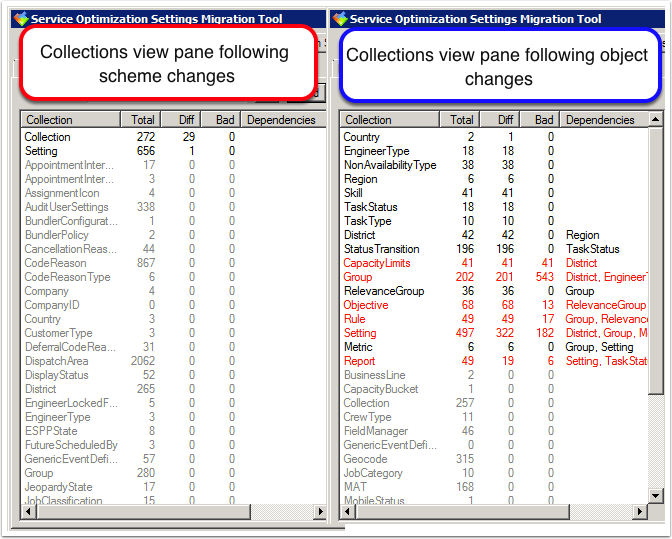
- Columns are as follows:
- Collection
- Summarises the analysis, results arranged by type. Collections are sorted as
follows:
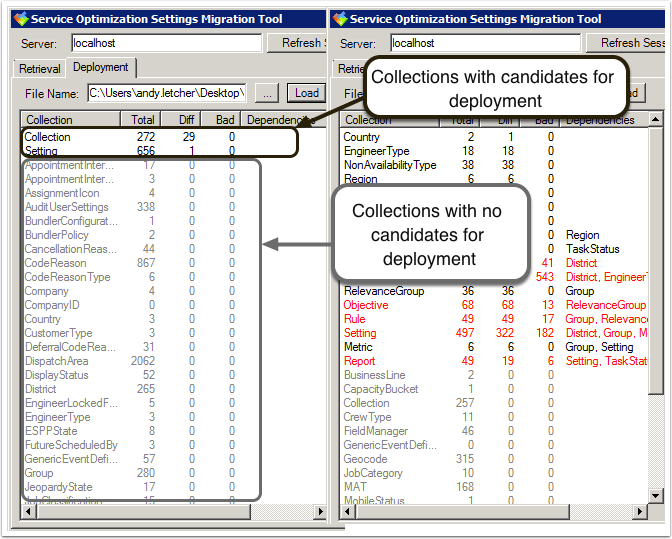
- Collections containing candidates for deployment are listed first, sorted alphabetically and coloured back, or red if the Collection contains any items with bad references.
- Collections without any candidates for deployment are listed next, sorted
alphabetically and coloured grey. Settings Migration Tool includes them so users can see a summary of the
XoomXML file even when there is nothing to deploy.
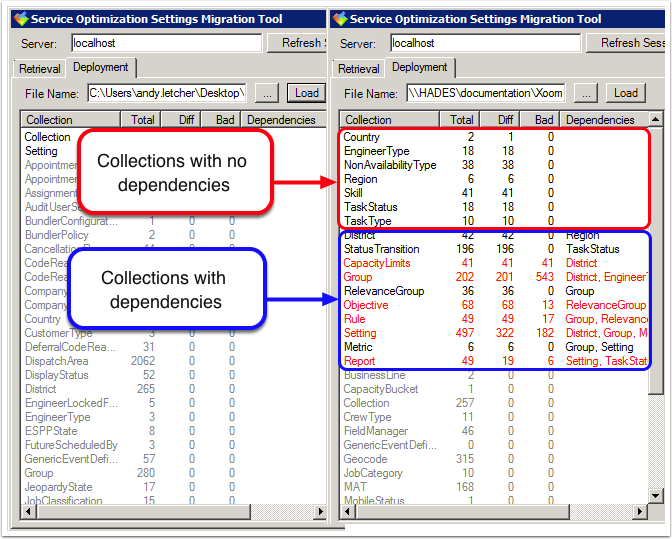
- Collections with no dependencies are listed before those with dependencies. Both are sorted alphabetically.
- Collections with no dependencies are usually simple Dictionaries.
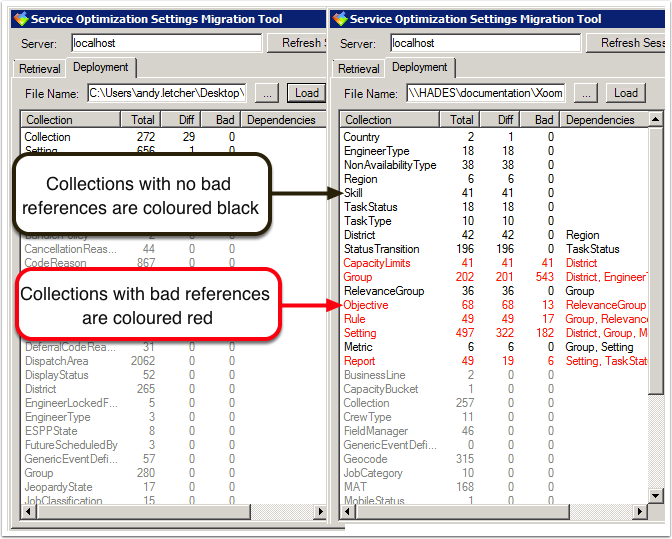
- Collections that contains items with bad references are coloured
red; those with no bad references are coloured black.
- Total
- The total number of items belonging to the given Collection (in XoomXML).
- Diff
- The number of items belonging to each Collection that are candidates for deployment (that is items where there is a difference between the XoomXML and live configuration).
- Bad
- The number of candidates for deployment that have bad references.
- Dependencies
- A comma-separated list of Collections upon which one or more items in the listed Collection depend. The dependency is only listed if the items causing the dependency are not yet in the Service Optimization database. So, for example, a XoomXML file with both a new Region and a number of new Districts that were unconnected to that Region, wouldn't show a dependency between District and Region. This is because the new Districts can be deployed independently of the new Region.