The Scheme Dependencies GraphML report creates a GraphML document intended for visualisation of dependencies between specified Collections in the Service Optimization Scheme.
The report geneates a GraphML document which can be loaded into yEd (or any other suitable diagram tool that supports GraphML) in order to produce visualisations of Scheme dependencies. This is extremely useful when trying to distinguish the Objects that constitute configuration from those that constitute master data, and when trying to determine which Collections are effectively transactional owing to the nature of their dependencies. Both situations are important in migration and upgrade scenarios.
The report should be run from Xoom Processor and requires as a source either the Scheme named query retrieved from live configuration, or a XoomXML file containing the Scheme. The report expects a parameter called IncludedSourceCollections. The parameter is a string. It should contain all Collections you want included in the graph, and consider, therefore, to be part of the core group. The string must start and end with a space, and each Collection name be separated by a space. Dependencies of each Object will be calculated (dependent Collections will also be included in the graph, but aren't considered to be sources of further references.)
Example
- xp :Scheme # =:IncludedSourceCollections=" District Region Group Setting " Reports\SchemeDependenciesGraphML.xsl MyConfiguration.graphml
Example graph
In this example we have retrieved a more complex set of Objectss comprising: all
Collections retrieved by the Default named query,
with the exception of Scheme; all Dictionaries, as listed by Settings Migration Tool (note, Settings Migration Tool
does not list Dictionaries without an Object Reference). In yEd we have adjusted the
image by selecting and . This yields the following graph: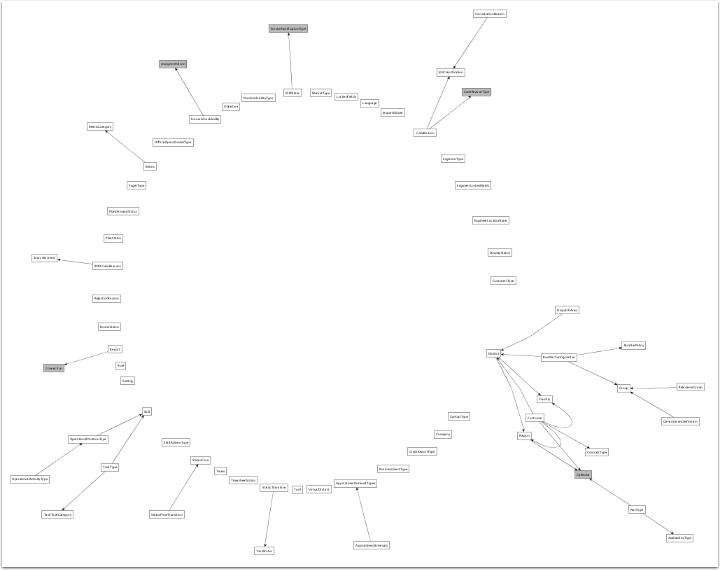
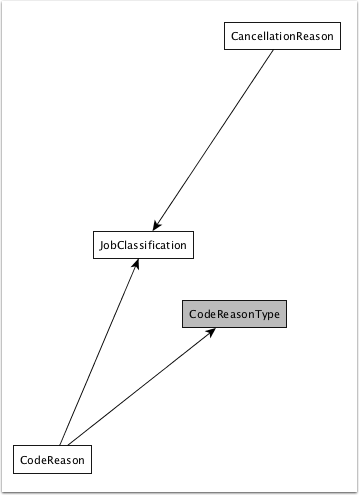
Collections that were specified by the
IncludedSourceCollections parameter string are shown as white
nodes. Arrows indicate references. Grey nodes show Collections that were not
specified by the parameter and that may therefore prove problematic in transportation
scenarios.